Thin wrappers around ggplot2::scale_y_continuous() and
ggplot2::scale_x_continuous() that remove the default lower expansion
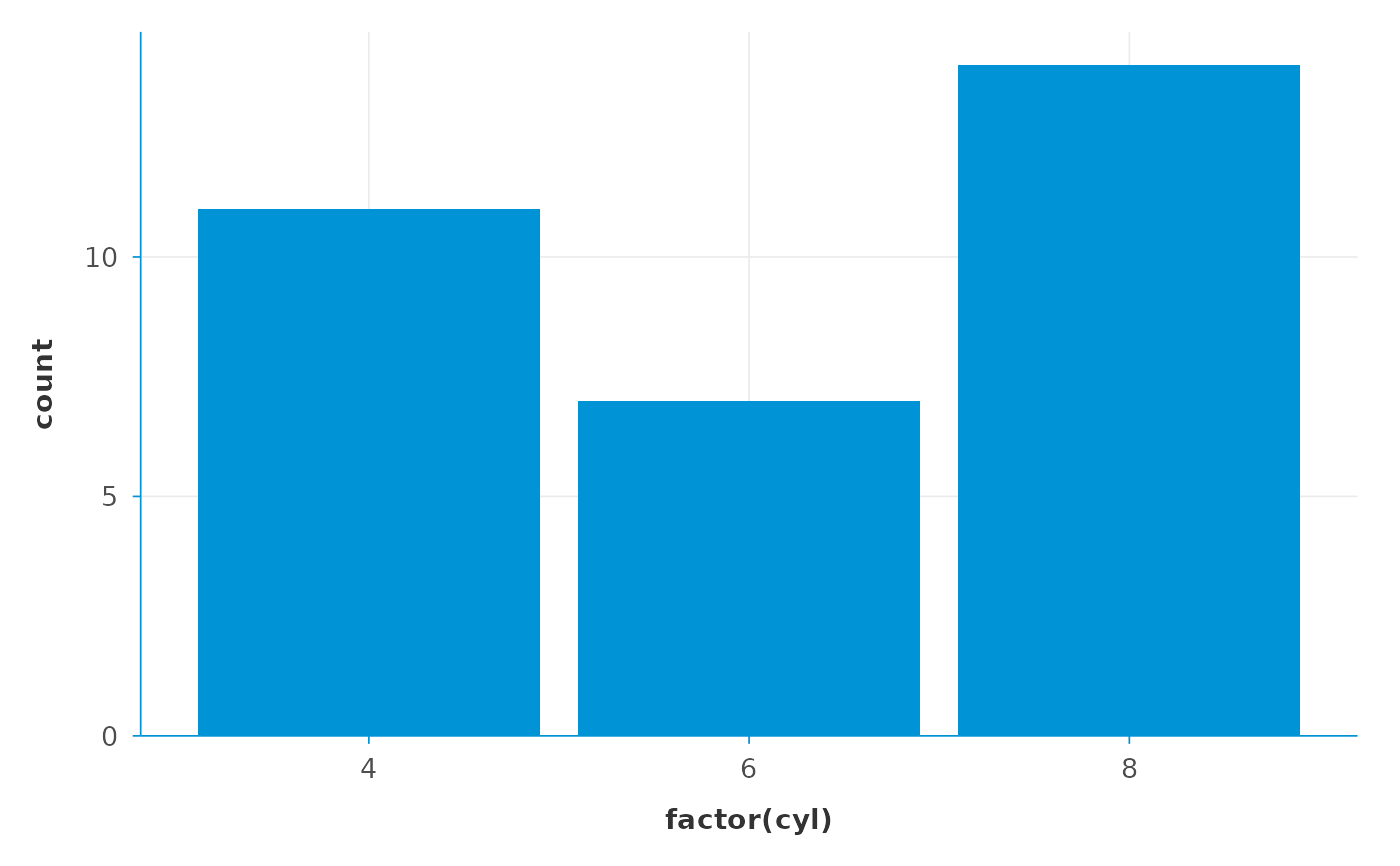
so that columns sit flush with the axis — the convention for WHO and
most publication-style bar charts. The upper expansion is preserved at
5% so the tallest column has breathing room above (or to the right of) it.
Arguments
- ...
Arguments forwarded to the underlying
ggplot2::scale_y_continuous()/ggplot2::scale_x_continuous().
Details
Use scale_y_dsi_col() for vertical bars (geom_col() / geom_bar())
and scale_x_dsi_col() when bars are horizontal (via coord_flip() or
geom_col(orientation = "y")).
Pass any other scale_*_continuous() argument
(labels, breaks, limits, ...) through ....