A sibling of theme_dsi() tuned for faceted plots. Where theme_dsi()
uses half-frame axis lines and only horizontal grid lines — a look that
suits a single panel — repeating those across every facet looks heavy
and the panels run together. theme_dsi_facet() replaces the axis
lines with a light panel border, draws grid lines on both axes, gives
the strip a soft background, and inserts whitespace between panels.
Usage
theme_dsi_facet(
  base_size = 12,
  base_family = "",
  accent = "#0093D5",
  grid_color = "grey92",
  strip_fill = "grey95",
  strip_color = "grey20",
  grid = c("both", "x", "y", "none"),
  legend_position = "bottom"
)
Arguments
- base_size
Base font size in points. Default
12.- base_family
Base font family. Default
""(system default). Set to"sans","Arial","Helvetica", or"Calibri"for a specific look. Empty default keeps the package portable on CRAN's Linux check machines, where Calibri is unavailable.- accent
Accent colour, kept for parity with
theme_dsi()so that the argument set is interchangeable. Not currently used in the facet variant — the panel border replaces the accent-coloured axis lines. Default"#0093D5"(WHO blue).- grid_color
Colour of the major grid (both axes). Default
"grey92".- strip_fill
Background fill colour for facet strips. Default
"grey95"— a light neutral grey. Avoid blues, which clash with the WHO-blueaccent.- strip_color
Text colour inside facet strips. Default
"grey20".- grid
Which direction(s) to draw major grid lines. One of
"both"(default — both horizontal and vertical),"y"(only horizontal),"x"(only vertical), or"none". Matches the identical argument ontheme_dsi()so the two themes can be swapped without changing other settings.- legend_position
Position of the legend. Default
"bottom". Pass"none","top","right", or a numeric vectorc(x, y).
Details
Use theme_dsi() for single-panel plots and theme_dsi_facet() for
plots with facet_wrap() or facet_grid(). Shared elements (text
styles, title block, legend, plot margins) match theme_dsi() exactly,
so the two themes feel like the same family.
See also
theme_dsi() for the single-panel sibling.
Examples
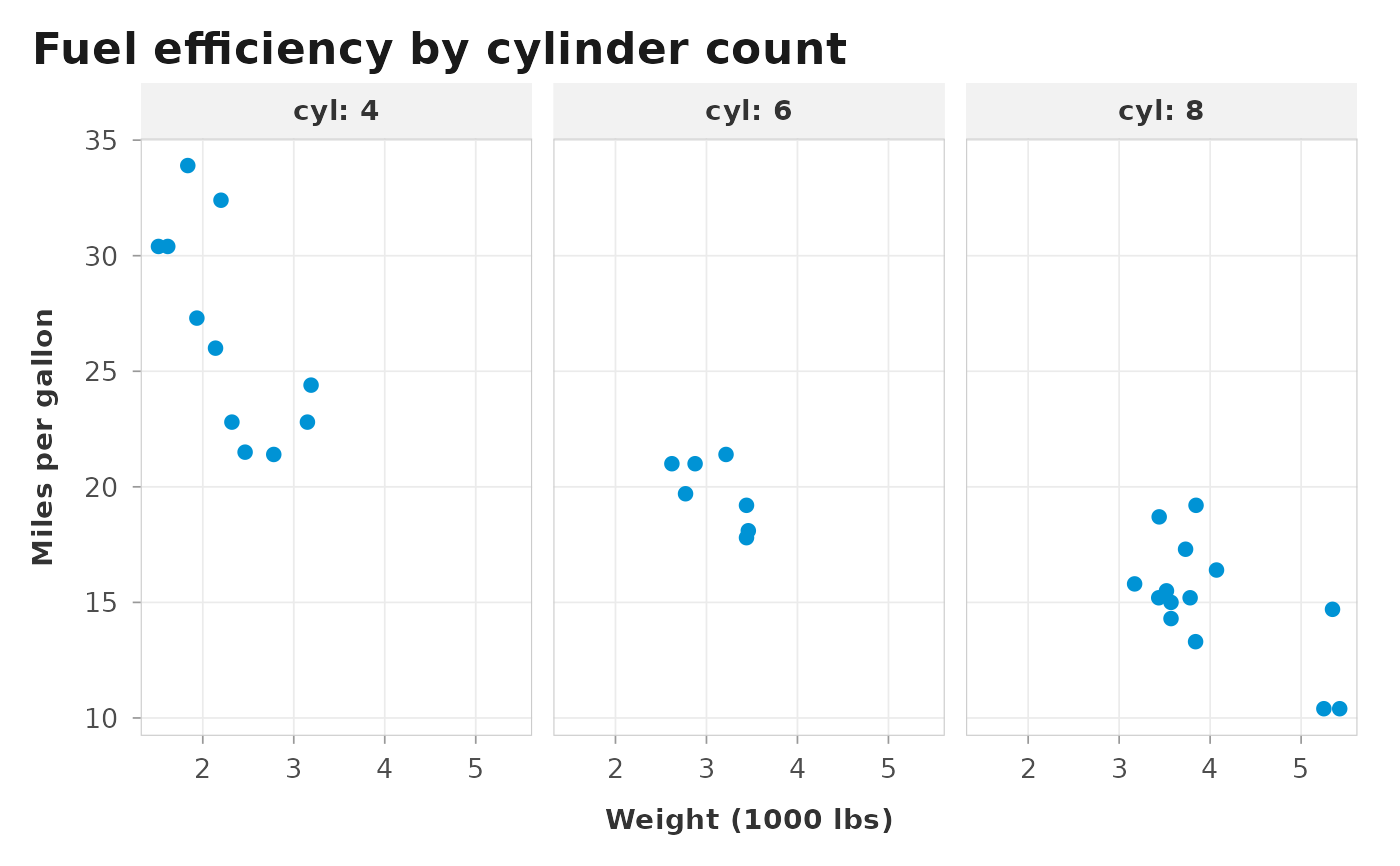
library(ggplot2)
ggplot(mtcars, aes(wt, mpg)) +
  geom_point(size = 2, color = "#0093D5") +
  facet_wrap(~ cyl, labeller = label_both) +
  theme_dsi_facet() +
  labs(title = "Fuel efficiency by cylinder count",
       x = "Weight (1000 lbs)", y = "Miles per gallon")